Charts in Virtual Cockpit
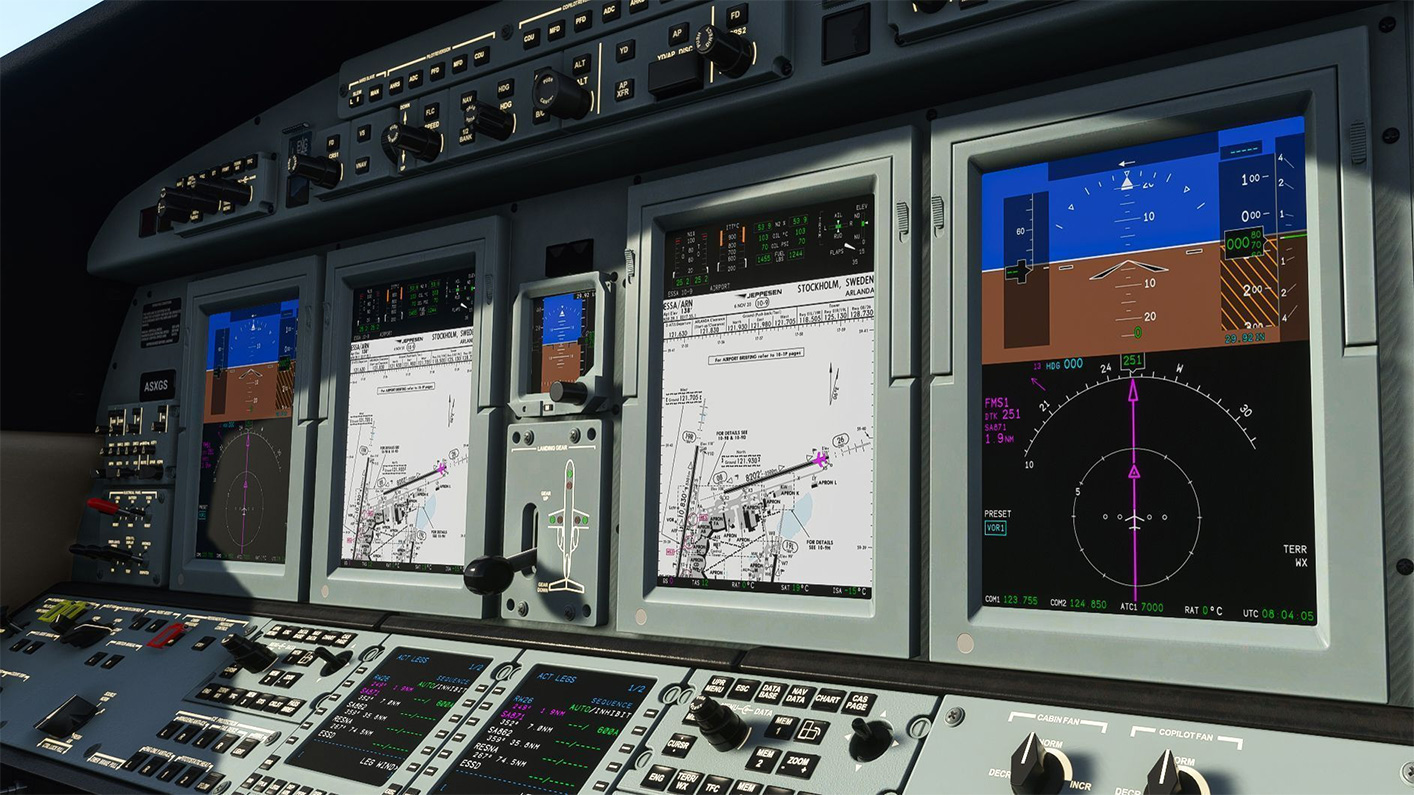
This page presents a select number of developers who have integrated airport charts in the virtual cockpit. As can be seen here, the UI is customized to best fit the cockpit environment, and is often made as accurate as possible to the real world implementation.
PMDGRead the “PMDG” section
PMDG was the first developer who integrated Navigraph charts into their virtual aircraft cockpits, with the 747-8 EFB back in 2018. They modeled their charts implementation to accurately reflect the actual 747-8 EFB. It also includes a night/dark mode for low light conditions.
Since the implementation in the 747-8, PMDG have added EFB with charts option to their 737 NGXu and 777-200ER products.
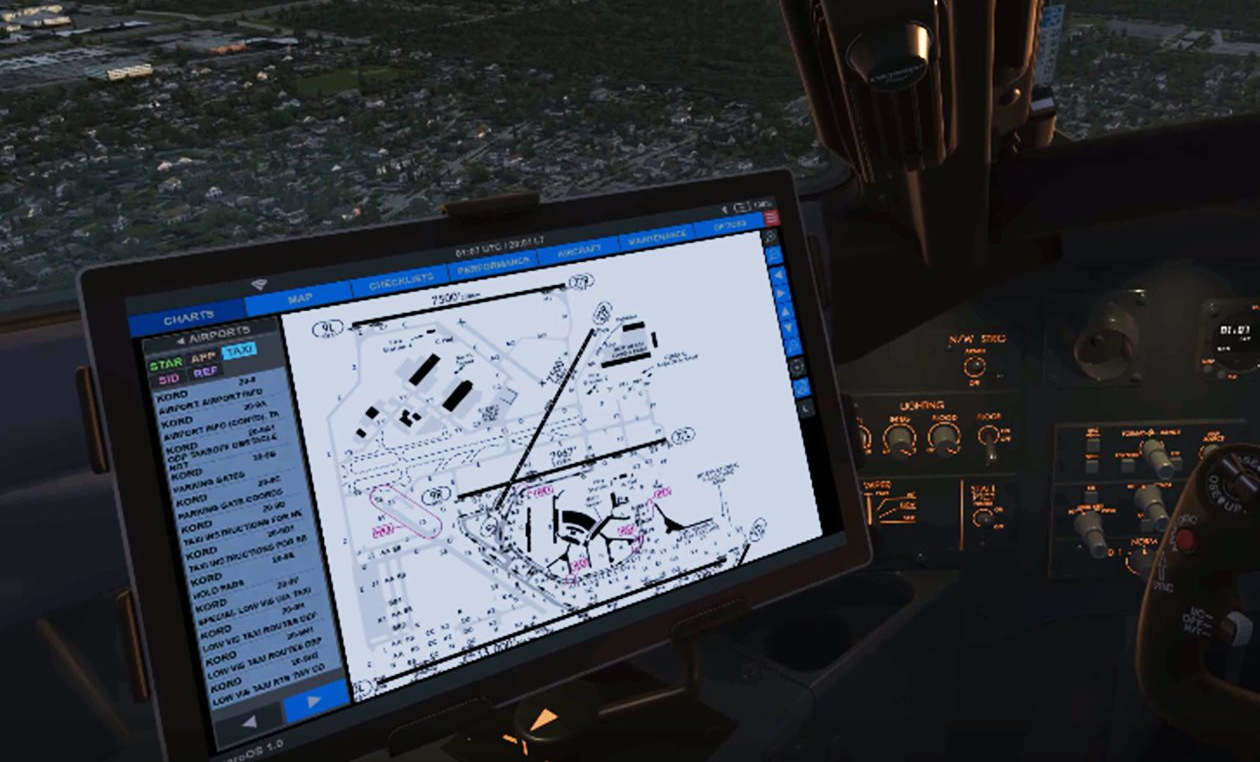
AerosoftRead the “Aerosoft” section
Aerosoft has added Navigraph Charts integration into their CRJ Professional (for Prepar3D) and A330 Professional product EFBs. Their implementation also supports moving maps.
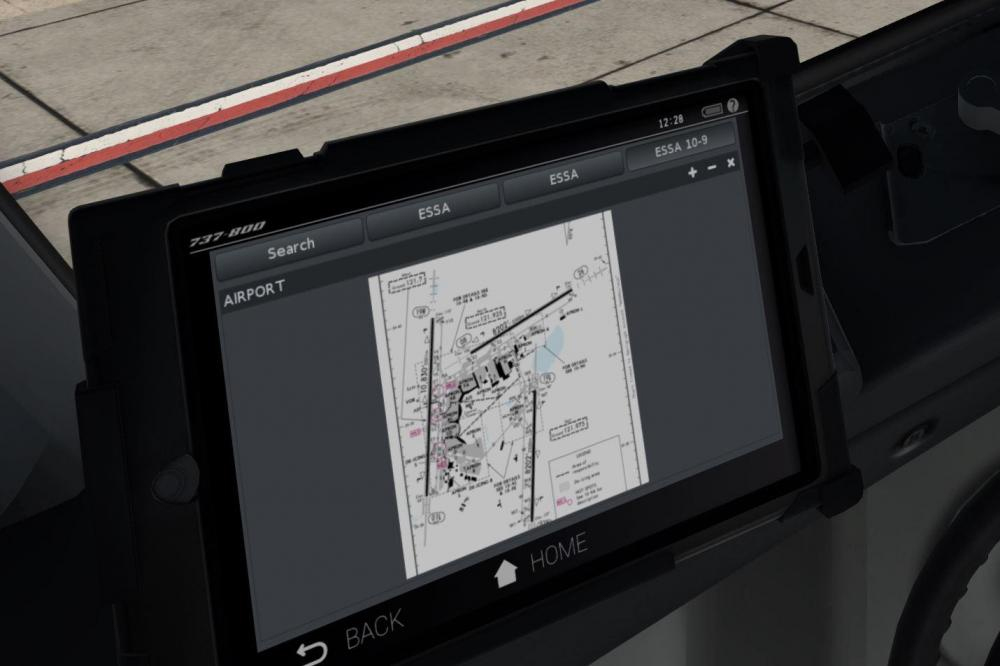
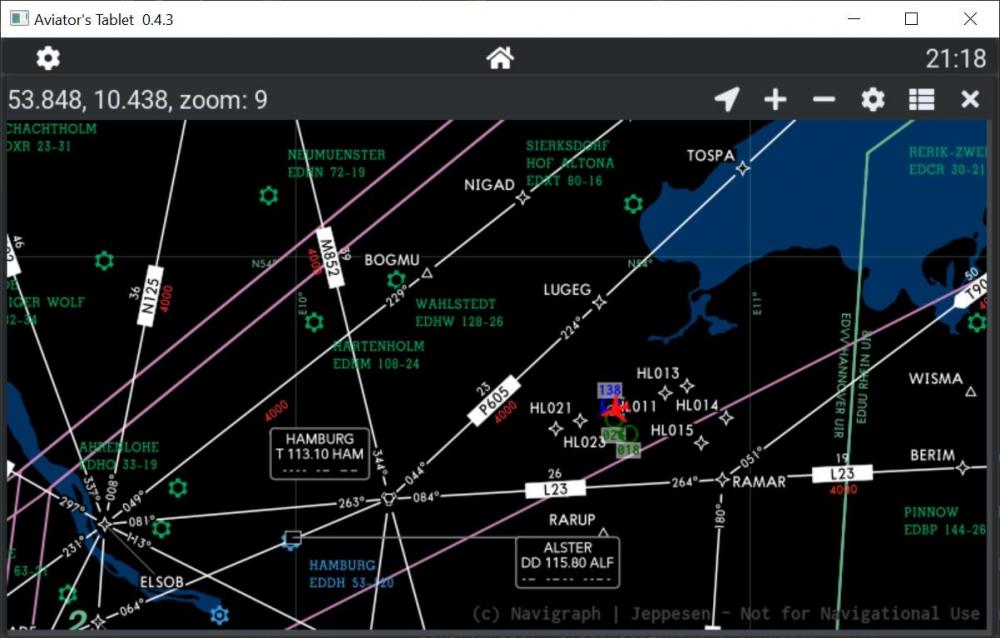
AvitabRead the “Avitab” section
A versatile addon for X-Plane, Avitab can be used in various aircraft including the popular Zibo 737-800 mod. Avitab displays ownship position (moving maps) andn also works great in VR.
Avitab has recently also integrated the Navigraph High/Low enroute charts, for reference and flight tracking of the enroute sections of the flight.
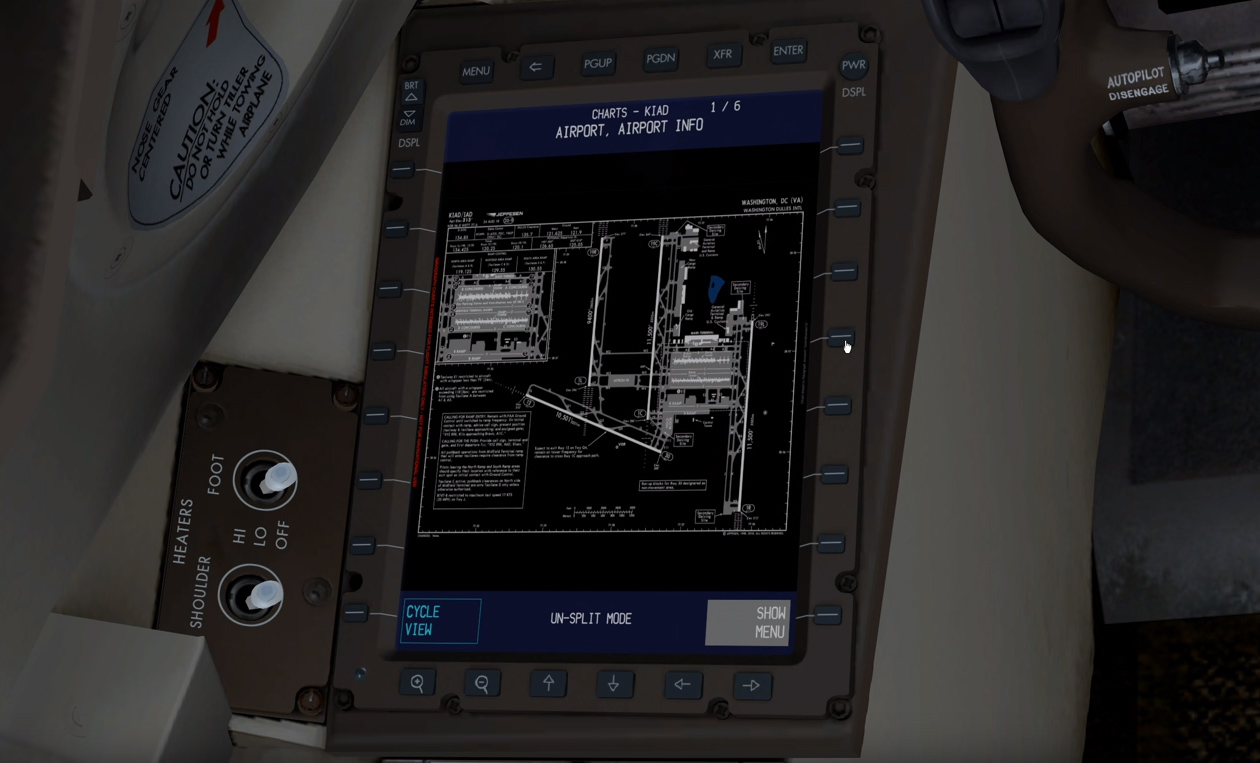
Working TitleRead the “Working Title” section
Working Title has made the first Navigraph Charts integration to the cockpit environment of an in-game Microsoft Flight Simulator 2020 aircraft: their Cessna Citation CJ4 mod.
The charts are integrated just like in the Proline 21 avionics system featured on the real CJ4 and work seamlessly in conjunction with the FMS. This feature was originally developed by Jeppesen and Rockwell Collins and we are excited to be able to contribute to the realism by enabling the same functionality to the flight simulation community through our Charts API.